Getting started with server monitoring and alerting
This short article loosely follows my previous adventures in self-hosting services such as mail server, file server and document server; this time, I’ll show you how I handled server monitoring and alerting so that no matter what happens to the server, I can be quickly alerted.

This short article loosely follows my previous adventures in self-hosting services such as mail server, file server and document server; this time, I’ll show you how I handled server monitoring and alerting so that no matter what happens to the server, I can be quickly alerted.
First, let’s introduce today’s actors:
- Prometheus, for scraping data from various sources
- Node Exporter, for providing Prometheus data about the host machine
- Node Exporter Smartmon, for appending S.M.A.R.T. data to Node Exporter output
- cAdvisor, for providing Prometheus data about running containers (if you remember, everything on the server runs in a Docker container)
- Alertmanager, for sending alerts to Slack based on data in Prometheus
- Grafana, for visualising data from Prometheus
- Netdata, just because we can 🤣 And it looks so cool! 🤩
In this article, I’ll show how I’m monitoring a single server, although the entire setup can be easily scaled nearly to infinity – you’d have one (or more) node(s) scraping, collecting, analysing and visualising all the data from all the nodes.
As before, I deployed everything to Dokku so I’ll be showing everything in terms of Dokku commands, but these can be easily converted to other methods of deployment, like docker-compose.yml (🤮🤣), or likely into a Kubernetes deployment. I’m fairly confident that Dokku commands are easily readable and understandable even to those not familiar with Dokku, but if you’re interested in docker-compose.yml version, let me know in the comments and I’ll try adding it later.
Stealing fire with Prometheus 🔥
Let’s start by creating a new app for Prometheus and pulling the required image:
dokku apps:create prometheus

docker image pull prom/prometheus:v2.15.2
docker image tag prom/prometheus:v2.15.2 dokku/prometheus:2.15.2
Prometheus and Node Exporter are sort of annoying in the way that they can’t be configured using environmental variables at all – most of the configuration can be adjusted in config file only, and some can be only changed by appending a parameter to the executed binary. That seemingly poses a problem in Dokku environment because there’s no intuitive way of passing the arguments – until you discover two pieces of crucial information:
- Prometheus’
Dockerfilecorrectly separatesENTRYPOINTandCMDdirectives, nice 👌 - Despite Dokku’s documentation not being really clear on this point, you can override the value of
CMDfor Docker image-based deployments
With that in mind, let’s adjust the default CMD directive with --web.enable-lifecycle option, allowing us to instruct Prometheus to reload its configuration file remotely, without the need for restarting the entire container:
dokku config:set prometheus DOKKU_DOCKERFILE_START_CMD="--config.file=/etc/prometheus/prometheus.yml --storage.tsdb.path=/prometheus --web.console.libraries=/usr/share/prometheus/console_libraries --web.console.templates=/usr/share/prometheus/consoles --web.enable-lifecycle"The above command points to two directories, one for configuration and one for persistent data, so let’s create & mount them to have easy access to them from the host machine:
dokku storage:mount prometheus /var/lib/dokku/data/storage/prometheus/config:/etc/prometheus
dokku storage:mount prometheus /var/lib/dokku/data/storage/prometheus/data:/prometheus

sudo mkdir -p /var/lib/dokku/data/storage/prometheus/{config,data}
sudo touch /var/lib/dokku/data/storage/prometheus/config/{alert.rules,prometheus.yml}
sudo chown -R nobody:nogroup /var/lib/dokku/data/storage/prometheus
The above commands should also fix any permissions issue you might run into, as the Prometheus container runs under nobody user. As for the alert.rules and prometheus.yml configuration files, this is the setup I currently use (I plan to replace the external domains with Docker’s internal networking once Dokku 0.20.0 is released). Feel free to use it, but bear in mind that until we finish deploying all pieces of this setup, scraping data from cAdvisor and Node Exporter, as well as alerting via Alertmanager obviously won’t work.
Finally, deploy Prometheus, fix proxy configuration and secure the installation with Dokku’s HTTP Auth plugin:
dokku checks:disable prometheus
dokku tags:deploy prometheus 2.15.2
dokku proxy:ports-set prometheus http:80:9000
dokku letsencrypt prometheus
dokku http-auth:on prometheus <username> <password>
After accessing Prometheus at https://prometheus.<your-domain>.com, you should be welcomed by Prometheus Dashboard. Under Status ↝ Targets, you should see prometheus up, while cadvisor and node-exporter will be down for now. That’s fine, let’s bring them up now.
Raising Node Exporter up 🙌
As Node Exporter is made by the same team as Prometheus itself, the deployment process is eerily similar:
dokku apps:create node-exporter

docker image pull prom/node-exporter:v0.18.1
docker image tag prom/node-exporter:v0.18.1 dokku/node-exporter:0.18.1

dokku config:set node-exporter DOKKU_DOCKERFILE_START_CMD="--collector.textfile.directory=/data --path.procfs=/host/proc --path.sysfs=/host/sys"

dokku storage:mount node-exporter /proc:/host/proc:ro
dokku storage:mount node-exporter /:/rootfs:ro
dokku storage:mount node-exporter /sys:/host/sys:ro
dokku storage:mount node-exporter /var/lib/dokku/data/storage/node-exporter:/data

sudo mkdir -p /var/lib/dokku/data/storage/node-exporter
sudo chown nobody:nogroup /var/lib/dokku/data/storage/node-exporter

dokku docker-options:add node-exporter deploy "--net=host"
dokku checks:disable node-exporter
There two things worth noting here:
First, the /data directory. Node Exporter Smartmon will periodically write HDD’s S.M.A.R.T. status into that directory, and Node Exporter will append that status into its own output. That’s why there’s no separate scraping of Node Exporter Smartmon necessary (nor possible, really) – Smartmon does not expose an HTTP service, it simply transforms S.M.A.R.T. status into a text file in Prometheus format.
Second, to properly inspect the network traffic, Node Exporter must have access to all network interfaces (for some reason 🧐 Interestingly, Netdata does not have this requirement…). This is accomplished with the --net=host Docker option. Because the container will operate on the host network, zero-downtime deploy checks must be unfortunately disabled as well, otherwise, you’d probably run into an issue where two containers are trying to bind to the same port.
Before deploying Node Exporter, let’s prepare Node Exporter Smartmon as well:
dokku apps:create node-exporter-smartmon

docker image pull galexrt/node-exporter-smartmon:v1.1.0
docker image tag galexrt/node-exporter-smartmon:v1.1.0 dokku/node-exporter-smartmon:1.1.0

dokku storage:mount /var/lib/dokku/data/storage/node-exporter:/var/lib/node_exporter
dokku docker-options:add node-exporter-smartmon deploy,run "--privileged"

dokku tags:deploy node-exporter-smartmon 1.1.0

dokku proxy:disable node-exporter-smartmon
dokku domains:disable node-exporter-smartmon
As mentioned above, Node Exporter Smartmon does not expose an HTTP service, so it’s not necessary to have Dokku’s proxy interact with it. As smartmon requires root privileges to run, --privileged argument must be supplied to the Docker container.
Finally, let’s finish Node Exporter’s deployment:
dokku tags:deploy node-exporter 0.18.1
dokku proxy:ports-set node-exporter http:80:9100
dokku letsencrypt node-exporter
dokku http-auth:on node-exporter <username> <password>
If everything went well (and I did not forget to mention any step here 😅), you should be able to access https://node-exporter.<your-domain>.com/metrics after a short while. At the bottom of the output, a lot of entries starting with smartmon_ should be present. And in Prometheus’ Dashboard, node-exporter should now be showing as UP 🎉
Bringing cAdvisor to the party 🥳
Let’s quickly deploy the last scraper:
dokku apps:create cadvisor

docker image pull gcr.io/google-containers/cadvisor:v0.35.0
docker image tag gcr.io/google-containers/cadvisor:v0.35.0 dokku/cadvisor:0.35.0

dokku config:set cadvisor DOKKU_DOCKERFILE_START_CMD="--docker_only --housekeeping_interval=10s --max_housekeeping_interval=60s --disable_metrics=disk"

dokku storage:mount cadvisor /:/rootfs:ro
dokku storage:mount cadvisor /sys:/sys:ro
dokku storage:mount cadvisor /var/lib/docker:/var/lib/docker:ro
dokku storage:mount cadvisor /var/run:/var/run:rw

dokku tags:deploy cadvisor 0.35.0
dokku proxy:ports-set cadvisor http:80:8080
dokku letsencrypt cadvisor
dokku http-auth:on cadvisor <username> <password>
As before, if things went well, you should be able to access https://cadvisor.<your-domain>.com/metrics after a while, and cAdvisor should show as UP in Prometheus’ dashboard.
Nice, we have all the data we need, now let’s finally have a look at them!
Visualising with Grafana 📈
All of this should really feel like second nature to you by now:
dokku apps:create grafana

docker image pull grafana/grafana:6.6.1
docker image tag grafana/grafana:6.6.1 dokku/grafana:6.6.1

dokku storage:mount grafana /var/lib/dokku/data/storage/grafana:/var/lib/grafana
sudo mkdir /var/lib/dokku/data/storage/grafana
sudo chown 472:472 /var/lib/dokku/data/storage/grafana

dokku tags:deploy grafana 6.6.1
dokku proxy:ports-set grafana http:80:3000
dokku letsencrypt grafana
After accessing https://grafana.<your-domain>.com, you’ll be prompted to create a first user account, and after that, to add your first data source.
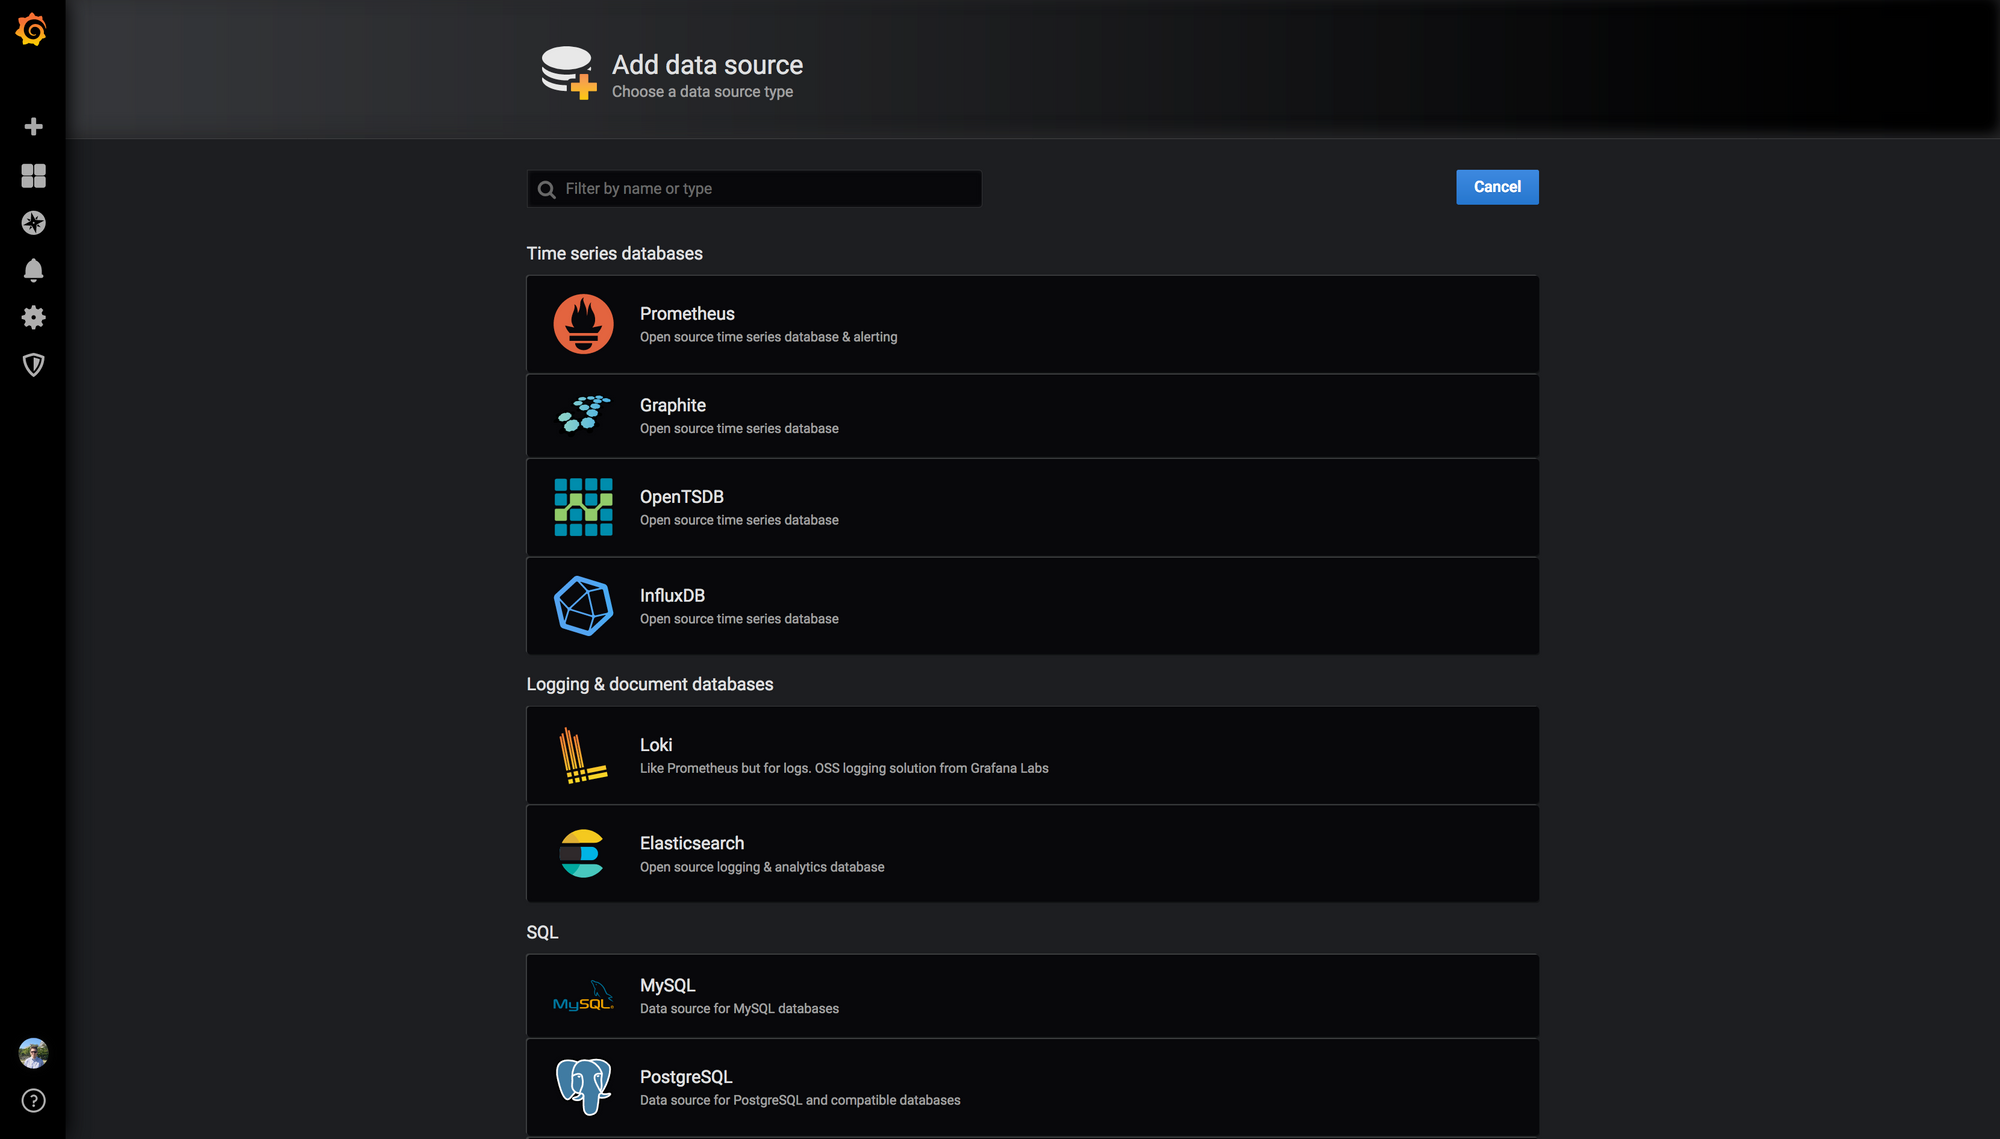
Our data source is, of course, Prometheus, so let’s choose that:
Since we enabled HTTP Basic Auth for our Prometheus installation, be sure to mention it in the data source configuration:
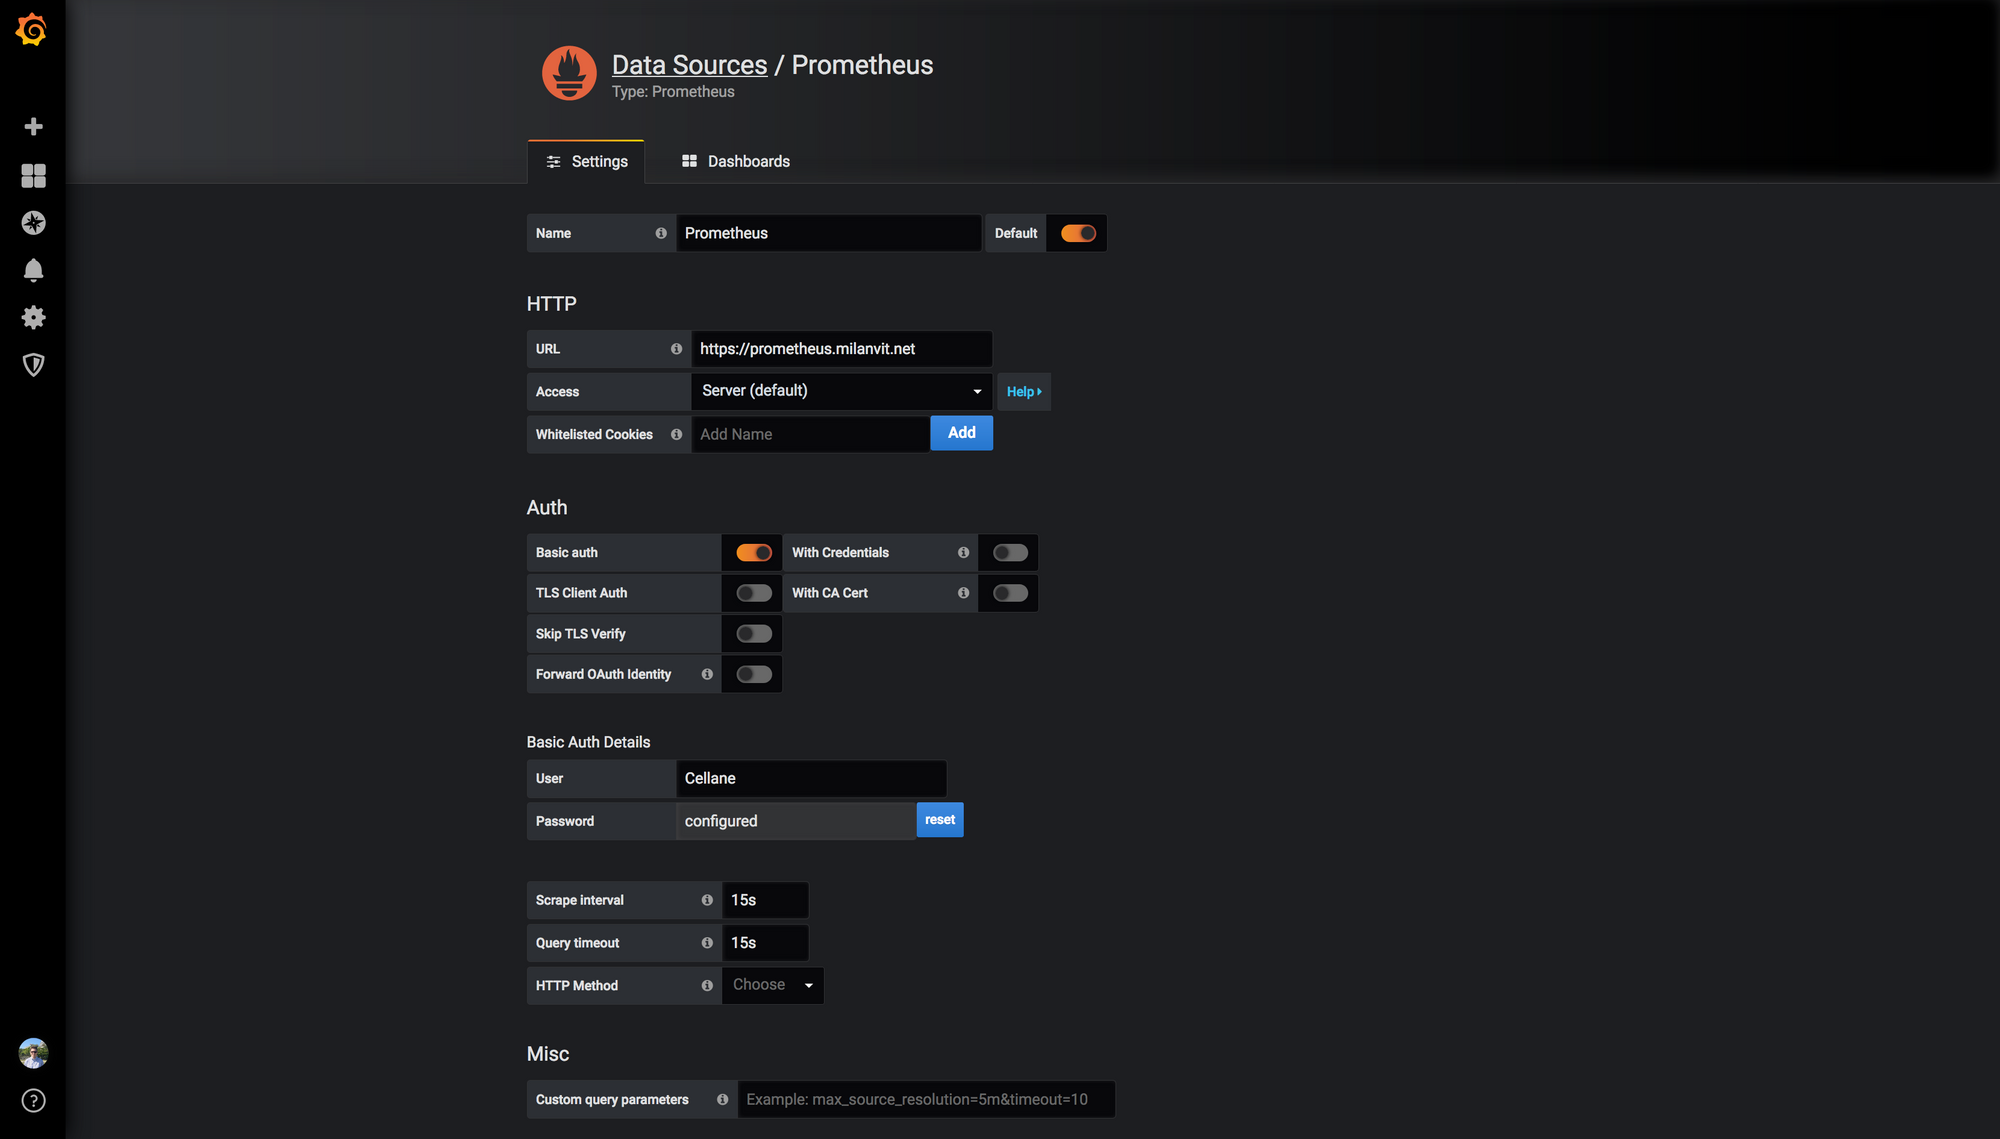
Hopefully, once you press the Save & Test button, the connection will be established 👌
Now, I’m both too lazy and too unskilled to actually create my own Grafana dashboards, but that’s fortunately not a problem as there’s a ton of publicly available dashboards – some of them are even good! Here are my top recommendations (bear 🐻 in mind 🤔, these will look slightly different after you import them yourself as I made small modifications to each):
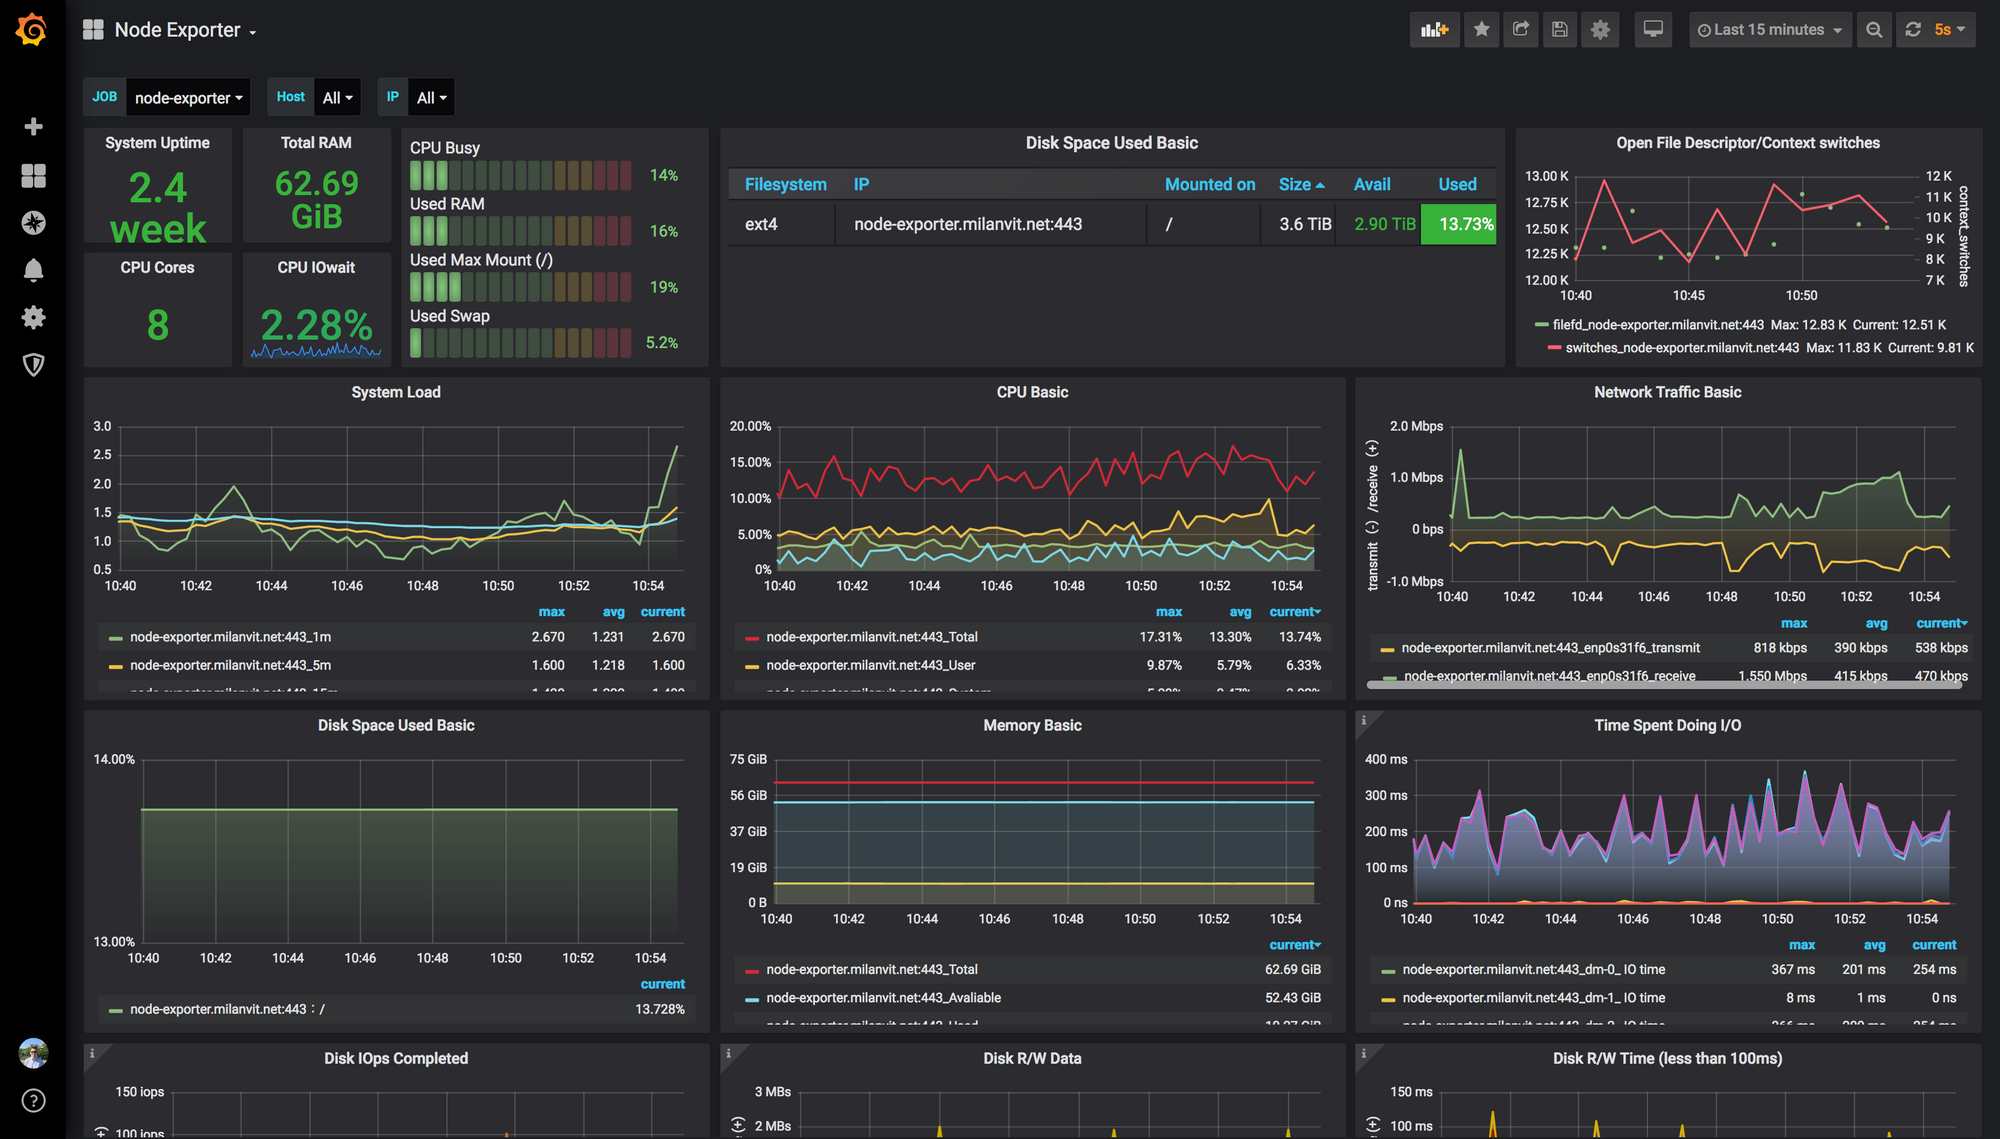
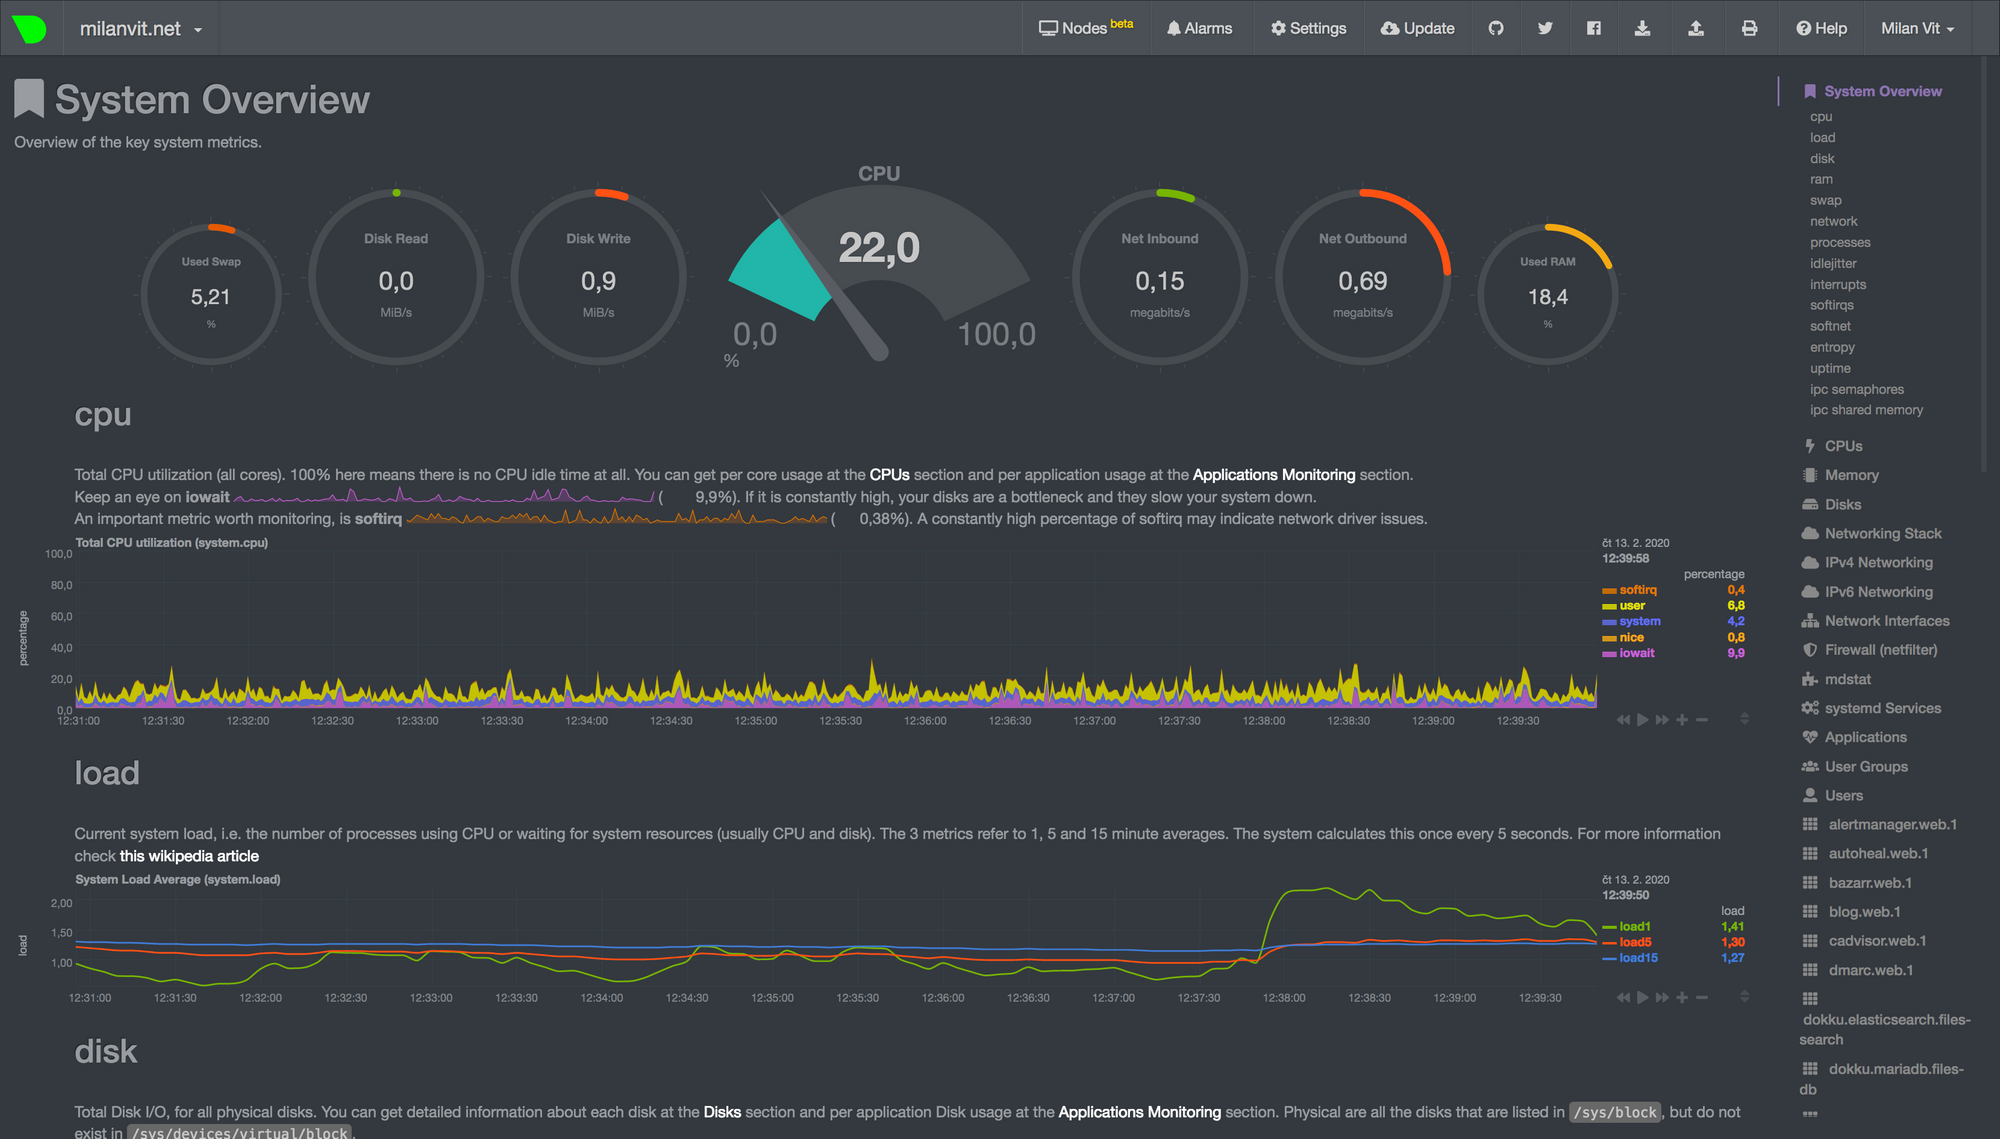
This is my default dashboard, it shows all the interesting data from Node Exporter.
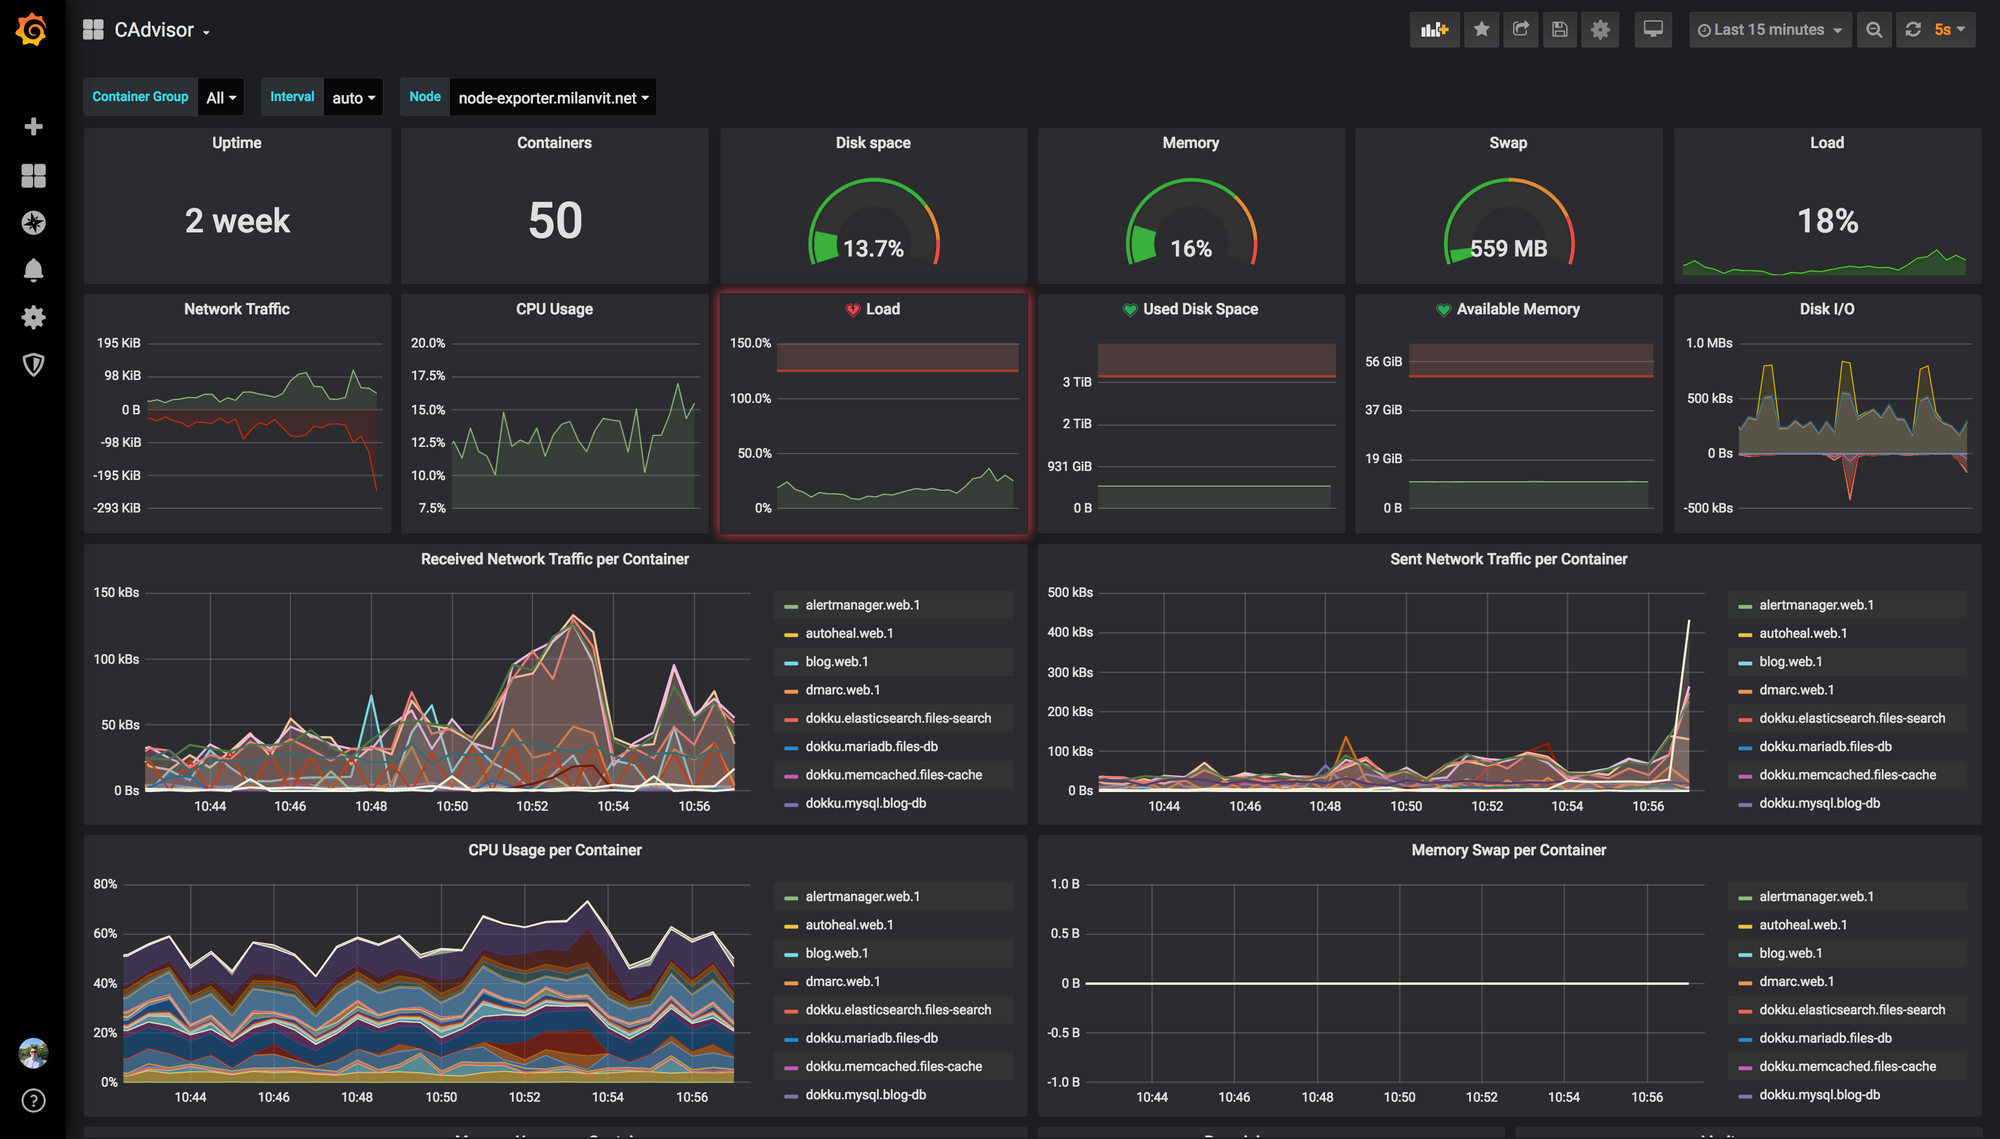
This dashboard shows everything related to Docker containers, but unfortunately, it’s a bit buggy. And it also highlights an issue with cAdvisor itself, namely – cAdvisor refuses to track container renames 😡 Relevant issue has been opened for many years, but the fix is still nowhere to be seen…
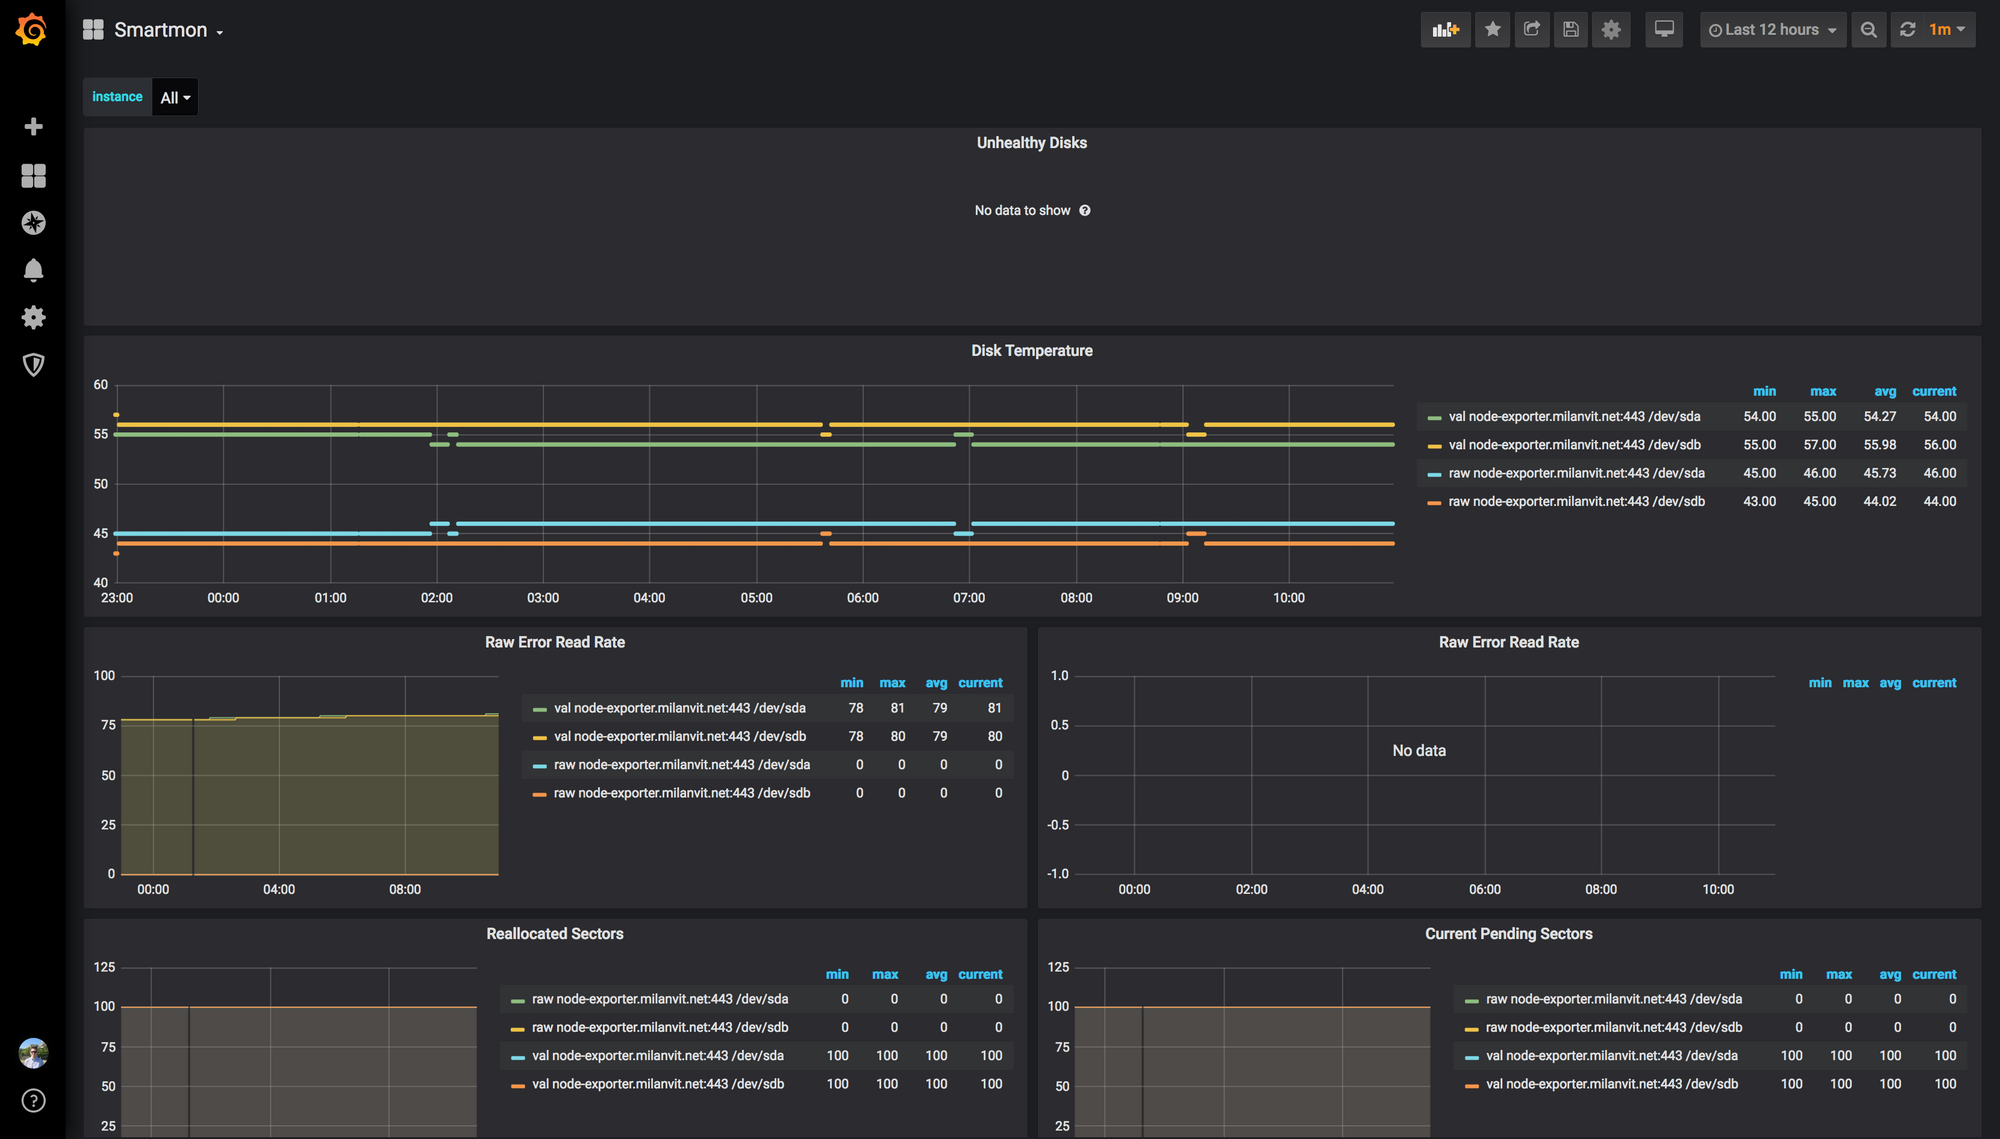
Finally, this is the dashboard for keeping track on the health of your drives.
Going proactive with Alertmanager 🔔
Looking at graphs is fine and dandy (and if you’re anything like me, you’ll probably spend the next few days just randomly looking at the pretty charts 😅), but getting actually notified when something unusual happens with your system – that’s even more useful.
If you used the alert.rules file from my listing above, you should already see many alert rule definitions in the Alerts section of Prometheus’s dashboard (you’re welcome 🙏) – but there’s nobody to deliver the notifications yet! Let’s fix that quickly:
dokku apps:create alertmanager

docker image pull prom/alertmanager:v0.20.0
docker image tag prom/alertmanager:v0.20.0 dokku/alertmanager:0.20.0

dokku storage:mount alertmanager /var/lib/dokku/data/storage/alertmanager/config:/etc/alertmanager
dokku storage:mount alertmanager /var/lib/dokku/data/storage/alertmanager/data:/alertmanager
sudo mkdir -p /var/lib/dokku/data/storage/alertmanager/{config,data}
sudo touch /var/lib/dokku/data/storage/alertmanager/{config/alertmanager.yml,data/notifications.tmpl}

dokku tags:deploy alertmanager 0.20.0
dokku proxy:ports-set alertmanager http:80:9093
dokku letsencrypt alertmanager
dokku http-auth:on alertmanager <username> <password>
As before, the listing for config/alertmanager.yml and data/notifications.tmpl is included in the GitHub Gist. If you wish to output the alerts to a dedicated Slack channel, you’ll need to create a Slack app, enable incoming webhooks for it, and create a webhook. The process definitely got a bit lengthier than I remember it 🧐
And that’s should be about it! If everything went well, you should start getting alerts on high CPU usage (both system-wide and when a single container goes crazy), high RAM usage, swap usage, when the disk starts filling up or starts malfunctioning.
One way of testing that notifications are working is to spawn a fork bomb: for example with docker run --rm -it busybox sh -c "while true; do :; done". Depending on your server’s hardware, you might need more than one, I think my server needed to run seven of these at the same time until a barrage of alerts bombarded me two minutes later.
Bonus round: going pretty with Netdata 💄
A few days after finishing this setup, I discovered Netdata. It’s fast, it’s pretty, it works well without any configuration – it’s really quite amazing piece of software 🤩 Theoretically, I think it’s possible to scrape Netdata’s data into Prometheus and visualise them with Grafana, but for now, I’m not really interested in that – I’ll be keeping my Prometheus for longer-term monitoring, and Netdata for visualising the last few minutes – at least, that’s the plan for now.
Let’s get down to terminal one last time:
dokku apps:create netdata

docker image pull netdata/netdata:v1.19.0
docker image tag netdata/netdata:v1.19.0 dokku/netdata:1.19.0

dokku config:set netdata DO_NOT_TRACK=1 PGID=999
dokku docker-options:add netdata deploy,run "--cap-add=SYS_PTRACE"
dokku docker-options:add netdata deploy,run "--security-opt apparmor=unconfined"

dokku storage:mount netdata /etc/group:/host/etc/group:ro
dokku storage:mount netdata /etc/os-release:/host/etc/os-release:ro
dokku storage:mount netdata /etc/passwd:/host/etc/passwd:ro
dokku storage:mount netdata /proc:/host/proc:ro
dokku storage:mount netdata /sys:/host/sys:ro
dokku storage:mount netdata /var/lib/dokku/data/storage/netdata:/etc/netdata
dokku storage:mount netdata /var/run/docker.sock:/var/run/docker.sock:ro

dokku tags:deploy netdata 1.19.0
dokku proxy:ports-set netdata http:80:19999
dokku letsencrypt netdata
dokku http-auth:on netdata <username> <password>
After that, this nearly never-ending list of graphs should be your reward:
There’s a way to configure Netdata more to your liking (hint: look at the storage:mount command above), and have it send automatic alerts to Slack (or anywhere else) as well, but this article is already dangerously close to reaching 2500 words, so I think I’ll cut it short for now 😅
Happy monitoring! 🎉